X min read
Table of contents

At Cloud-IAM we run Keycloak as a managed service. That means we operate a lot of clusters, across a lot of versions, under real production load. When something regresses, we do not get to file a ticket and wait. We instrument, we profile, and we find the root cause. This is the story of one of those hunts.
We upgraded a customer cluster to Keycloak 26.6. Three nodes, 4 vCPU and 8 GB each, the official image, nothing exotic.
For a while it behaved. CPU tracked request volume the way it should. Then, with no deploy, no traffic spike, no scheduled job, one node jumped to a flat 40% CPU and stayed there.
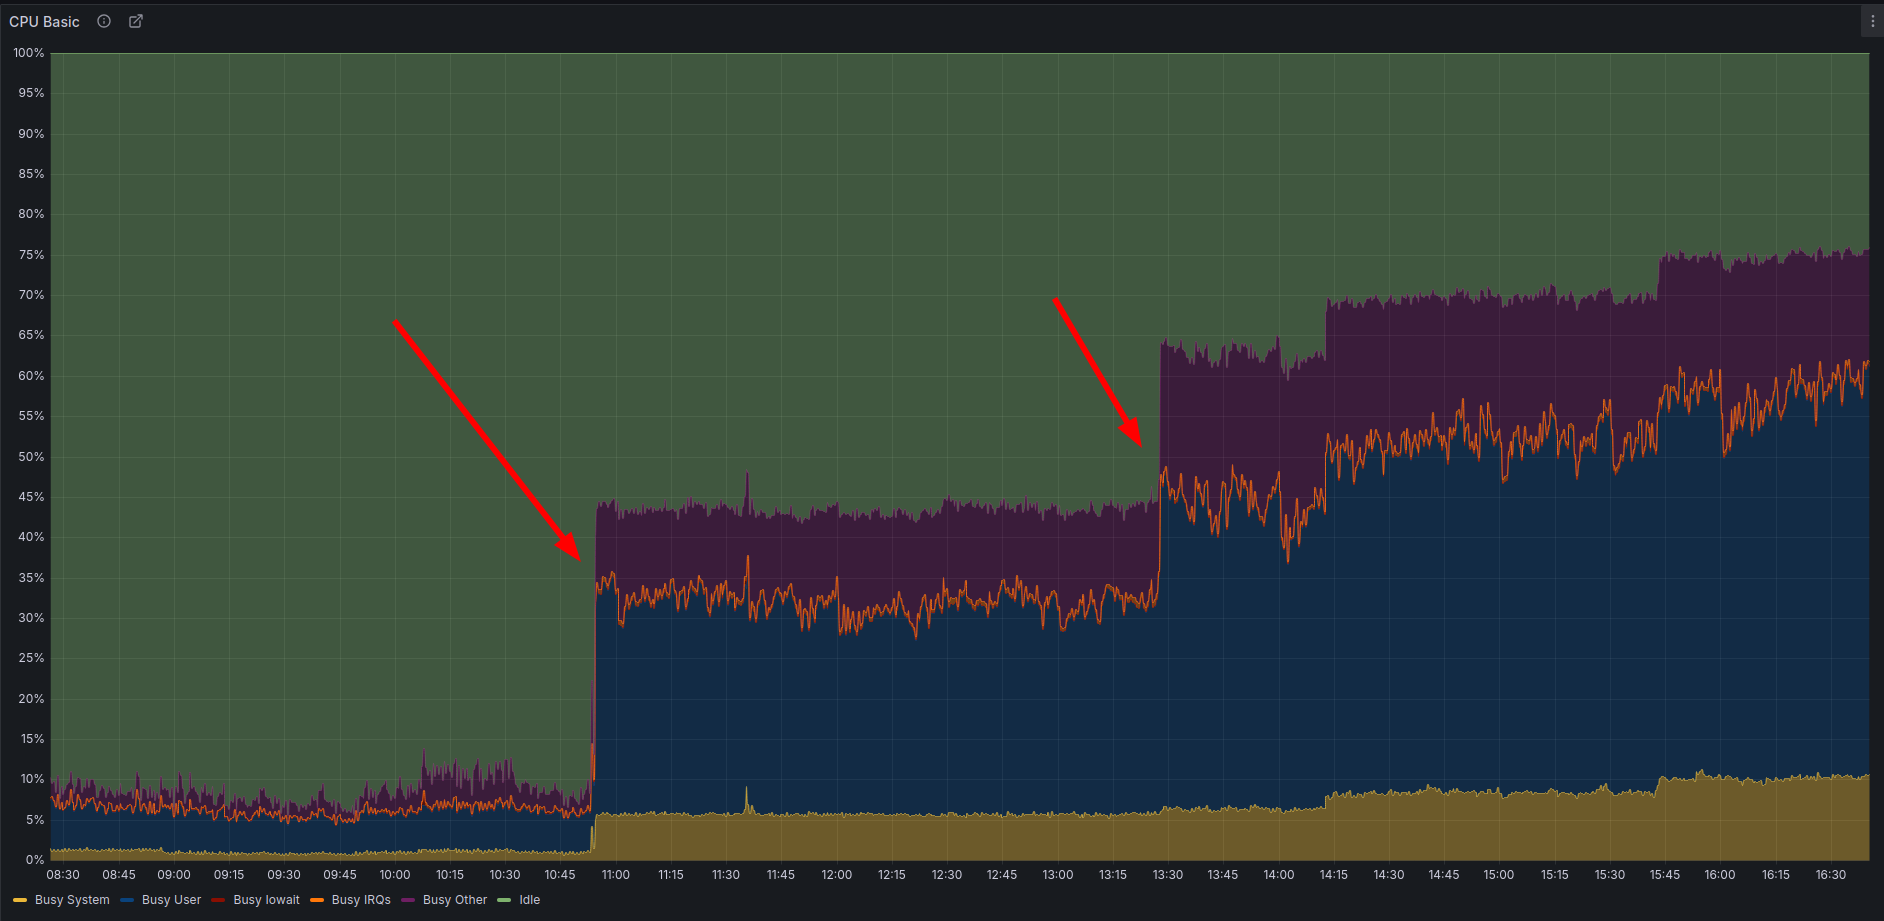
CPU Basic. Clean step changes, no rollback, ratcheting up over the day.
A few things made this interesting rather than routine:
CPU that is independent of traffic, survives draining, and only resets on restart is not a capacity problem. Something inside the process was spinning on its own.
The cluster runs a few of our own SPIs, so the honest first hypothesis was "it is us." We spent real time there. We pulled thread dumps and method profiles looking for our own packages on the hot path.
They were not there. Not in the stack traces, not in the method profiling, not in the allocation profile. The evidence kept pointing at the runtime itself, not at anything layered on top of it. So we stopped trying to make our code the culprit and followed the data.
This is worth stating plainly because it is the part people skip: the discipline is to drop the convenient theory the moment the profiler disagrees with it.
We attached JFR to an affected node and let it record through one of the CPU steps.
The thread context switch rate told the first part of the story. At baseline it sat around 3 kHz. During the event it jumped to roughly 40 kHz. That is not a thread doing work. That is a thread parking and being woken, over and over, as fast as the scheduler allows.
The allocation profile confirmed it. The single largest allocator on the heap was org.jboss.threads.EnhancedQueueExecutor$PoolThreadNode, sitting at 26.9 GiB of total allocations in a few minutes, far above any actual request payload. The executor's own pool-thread machinery was churning memory. The threads were busy being busy, not serving requests.
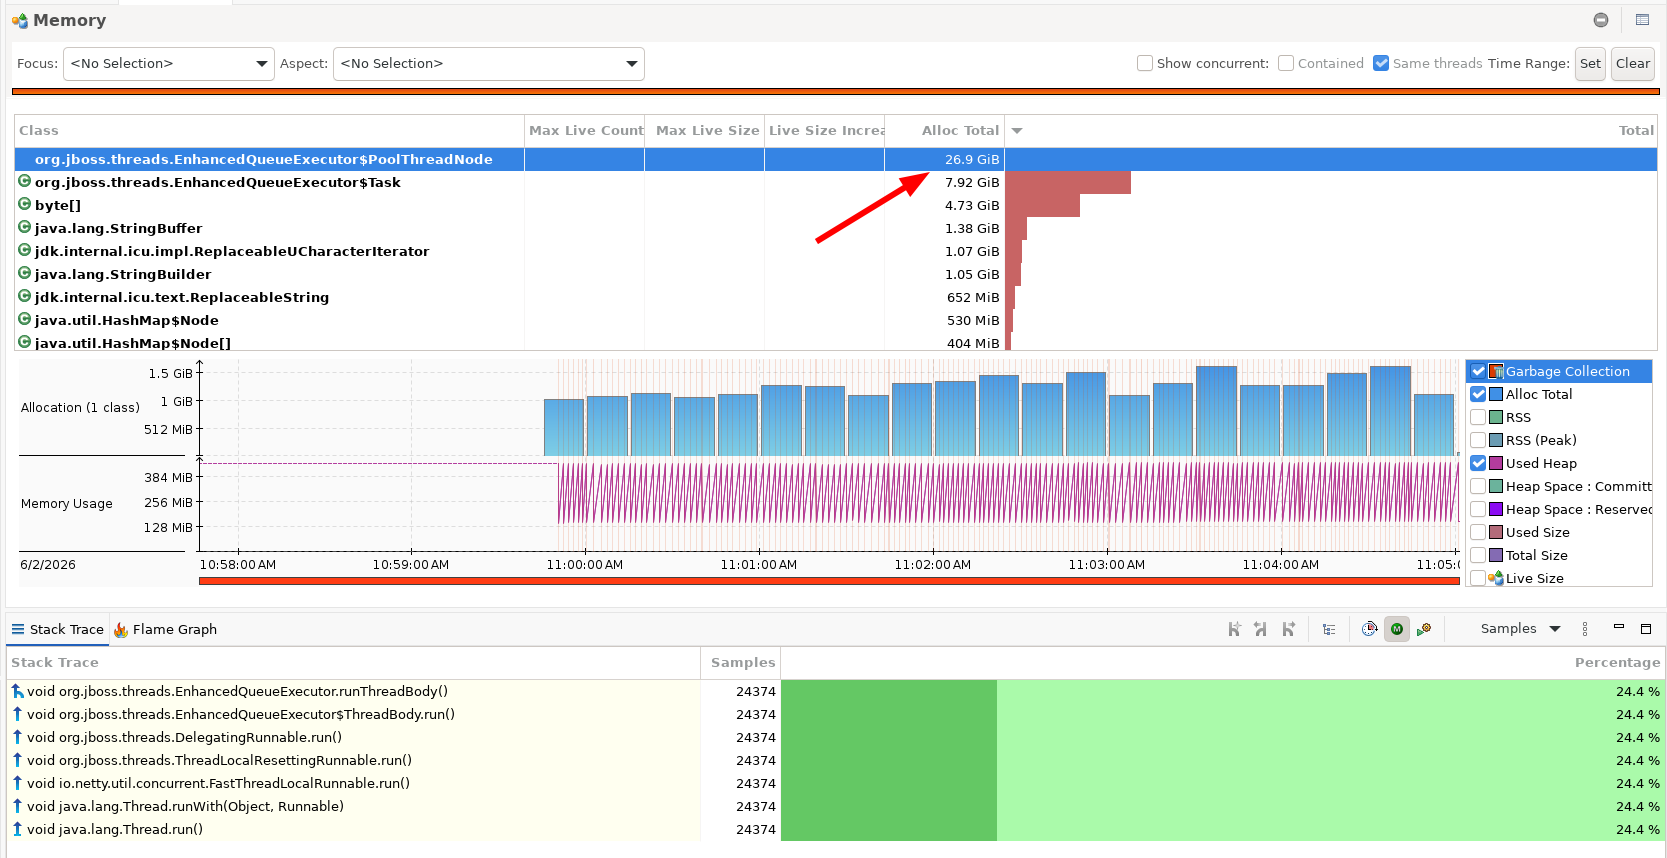
JFR Memory view. PoolThreadNode dominates Alloc Total at 26.9 GiB in minutes.
The method profile pinned it down. Around half of all samples were in EnhancedQueueExecutor$PoolThreadNode.park(), paired with System.unparkVirtualThread(). Park, unpark, park, unpark, in a tight loop. The CPU was being spent entirely on scheduling, on threads putting themselves to sleep and immediately being told to wake up.
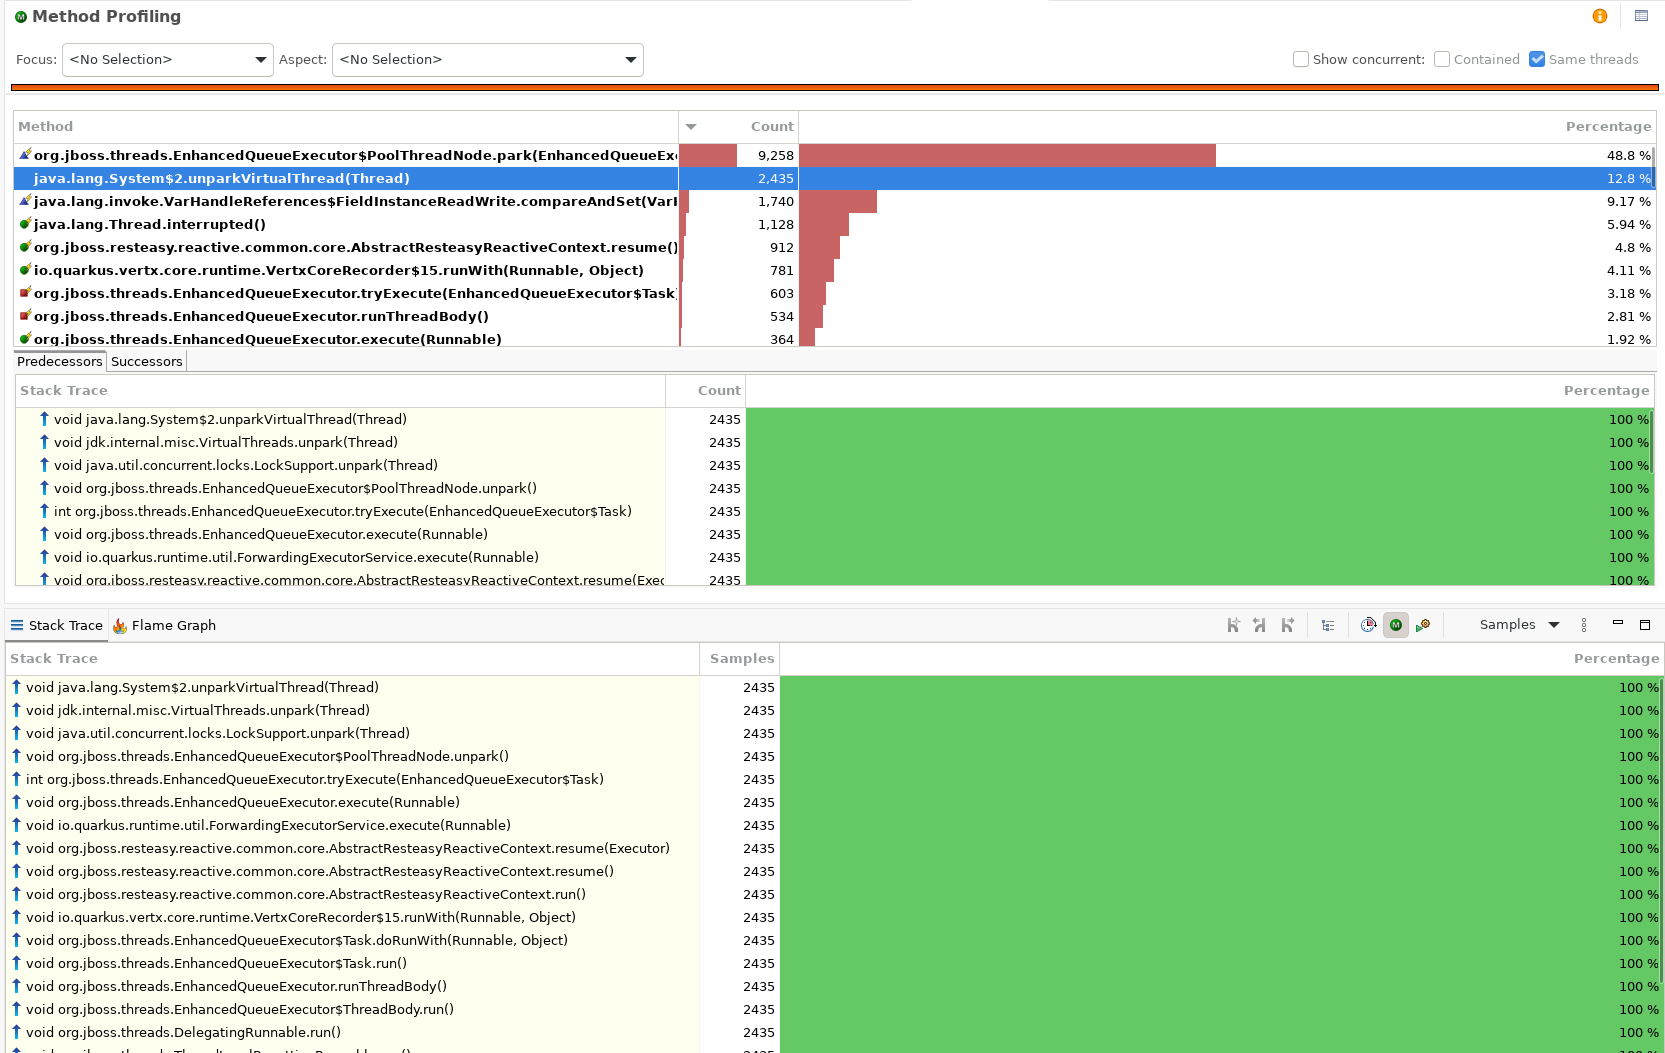
JFR Method Profiling. park() and unparkVirtualThread() dominate the samples.
So we had a clear mechanism for the burn: a tight park/unpark loop on the executor. The question became, what keeps re-arming it?
If work is being re-submitted forever, something must still be alive that should not be. We took a heap dump and went looking for request objects that had outlived their request.
They were there. Using Eclipse MAT, we found live instances of QuarkusResteasyReactiveRequestContext, the per-request object Quarkus RESTEasy Reactive uses to drive a request through its pipeline. We walked the shortest path to GC root for one of them. Some are still attached to a KeycloakSession, but they are marked as completed, so they can be set aside for this investigation.
The interesting ones are bound through Vert.x's internal mechanics, back into a live request context. These were not garbage waiting for a sweep. They were reachable, which meant the runtime still considered them in flight.
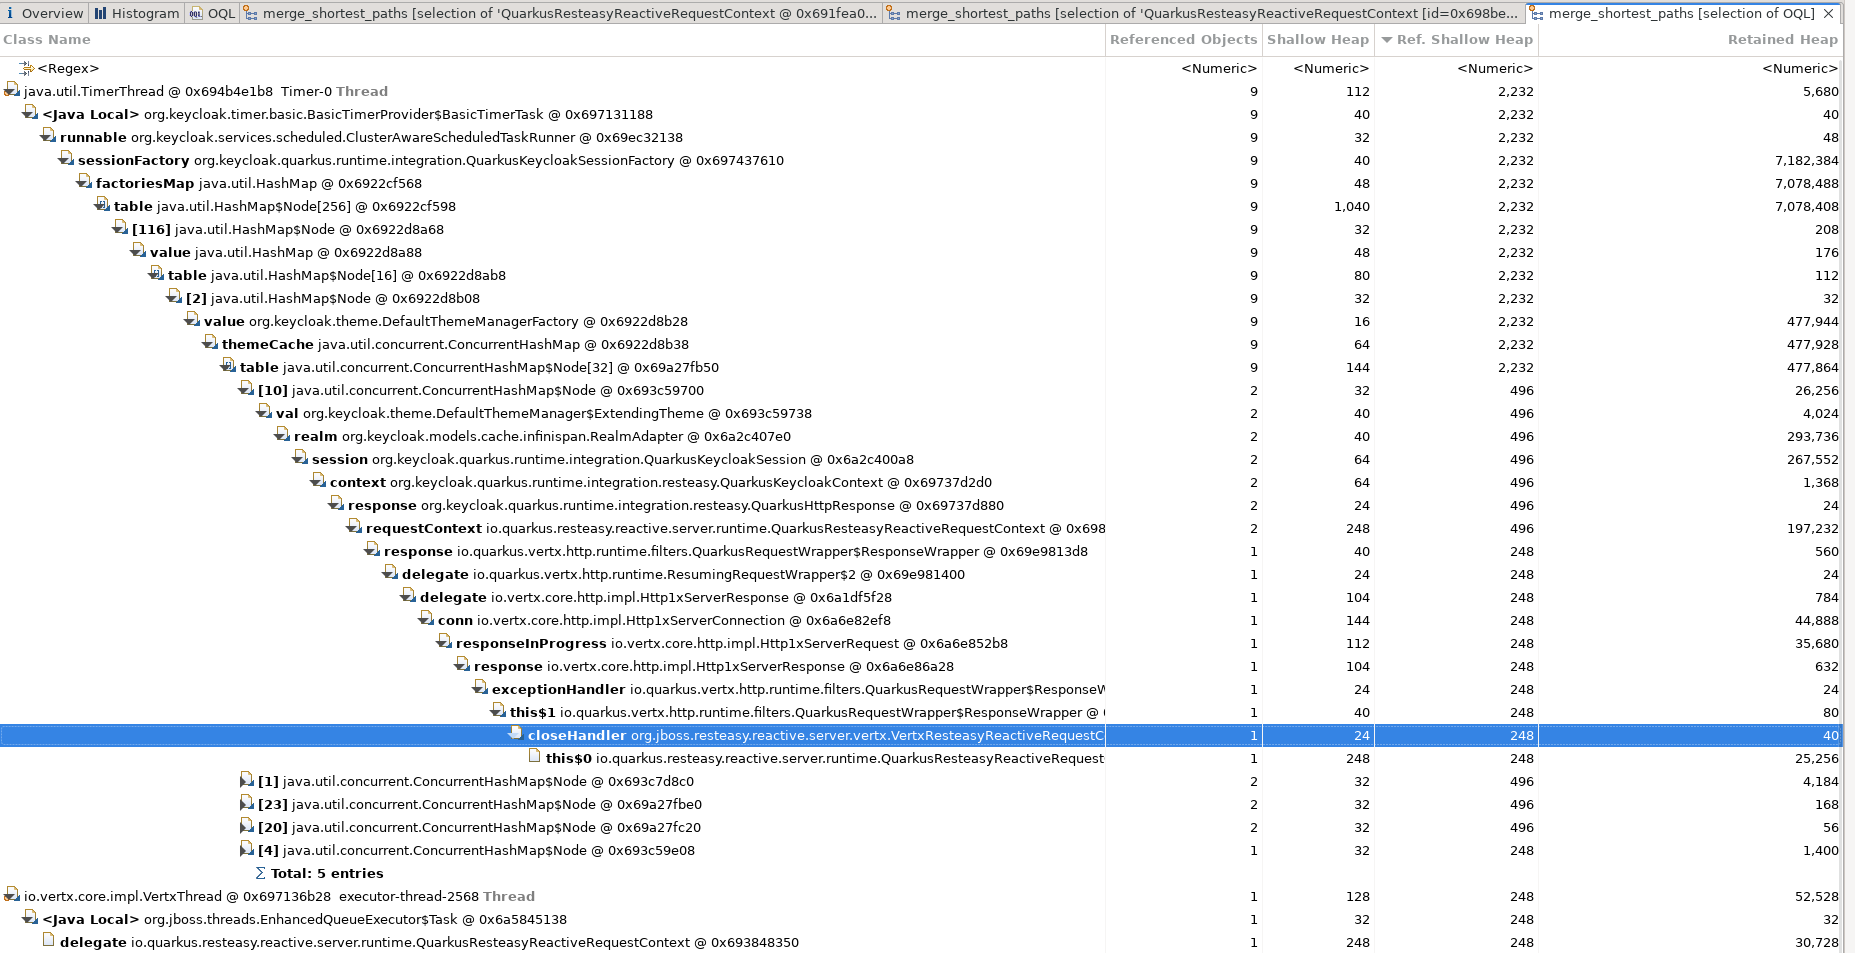
Path to GC root. A live request context retained through the Vert.x response chain.
Completed-looking requests, still pinned in memory, still considered active. That is the fuel. Now we needed the ignition.
In Quarkus RESTEasy Reactive, a request is processed by applying a chain of handlers in sequence. A position cursor tracks how far along the chain the request is. After each handler runs, the position advances and the next handler is invoked. The request is finished when position == handlers.length, that is, when the cursor reaches the end of the chain.
We wrote an OQL query against the heap dump to inspect those live contexts directly, comparing each one's position against the length of its handler chain.
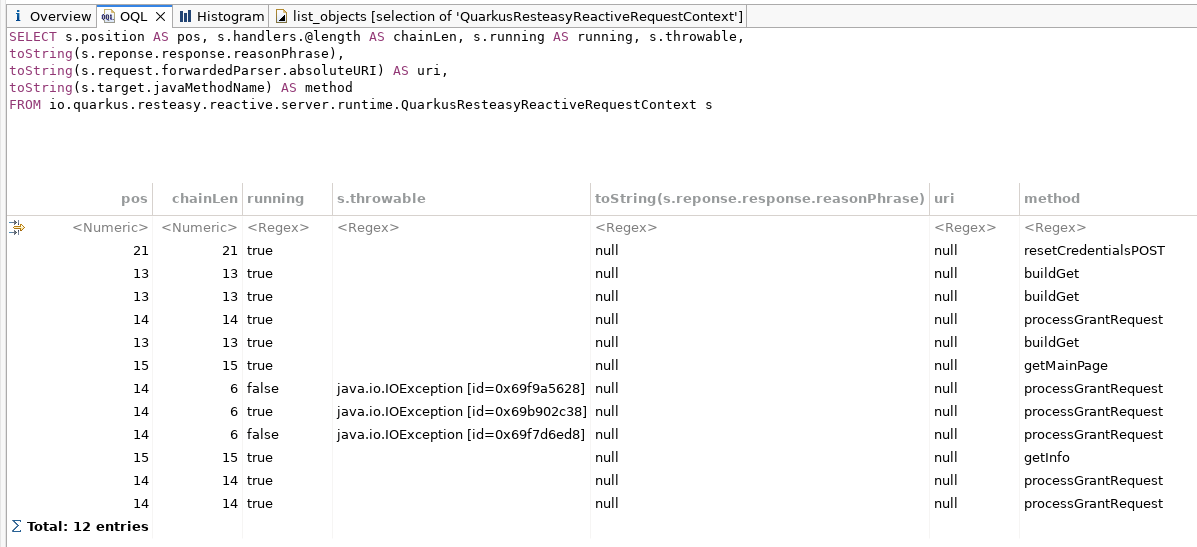
OQL over the live contexts. position (pos) sits well past the handler chain length (chainLen).
The result was the whole bug in one table. Several contexts had position = 14 while their handler chain length was only 6. The cursor was pointing at handler number 14 in a list that only had 6 entries. They were marked running, some carried an IOException, and there was simply no handler left for them to advance to.
A cursor past the end of its own array is not a state the happy path can produce. Something had moved the cursor independently of the chain it was supposed to be walking.
Here is what happens, with thanks to Steven Hawkins and Peter Zaoral for chasing it down into the code. It takes two things occurring at almost the same instant.
First, an exception during the reading of the request. A client connection drops mid-read, the body fails to parse, an IOException is thrown. RESTEasy Reactive handles this by abandoning the normal handler chain and switching the request over to a dedicated set of error handlers. That error chain is shorter. In the cases we saw, 6 handlers instead of the original longer list.
Second, at the same moment, the runtime calls discardRemaining(). Its job is exactly what the name says: ensure no further handlers run and release the resources tied to the request. It does this by jumping the cursor straight to the end:
/**
 * This method ensures that no more handlers will run and that all the resources tied
 * to the request are closed
 */
private void discardRemaining() {
    setPosition(getHandlers().length);
    close();
}
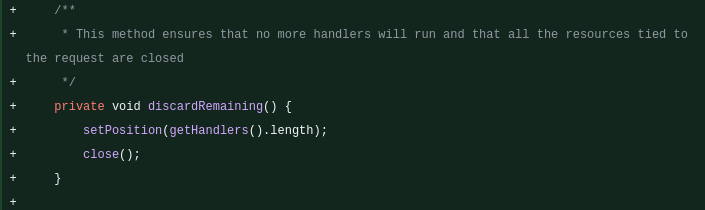
The method as it appears in the source diff.
In isolation, both operations are correct. The bug is in their overlap.
discardRemaining() reads getHandlers().length and sets position to it. But it reads the length of the handler list that was current when it ran, while the exception path is in the middle of swapping that list for the shorter error chain. The cursor ends up set from the old, longer list's length, and then points into the new, shorter list. Position 14 against a chain of 6.
From there the request is wedged. The termination condition is position == handlers.length. With position strictly greater than handlers.length, that equality can never be true. The request can never be marked done.
And that closes the loop we saw in the profiler. The executor picks the request up to make progress. It finds no handler at the current position, so it returns almost instantly, having done nothing. But the termination check still fails, so the request stays active and gets scheduled again. Pick up, find nothing, exit, re-queue. Forever.
That is the flat 40%. One wedged request is one pool thread locked into an infinite park/unpark spin. Each subsequent broken connection that loses the same race wedges another request, pins another thread, and adds its own +20%. Restart clears every wedged context at once, which is exactly why a restart fixed it and why the problem always came back.
You need a request to fail during read, specifically with an exception that triggers the error-handler swap, at the same instant that discardRemaining() runs on that request. On a quiet cluster you may never line those up. On a busy one with real clients dropping connections, you line them up eventually, on every node, at no particular rate. Which is precisely the behaviour we observed.
It is a genuine race, so it does not respect reproduction steps. That is what makes a heap dump and an allocation profile worth more here than any amount of staring at logs.
We think this is a fair illustration of what running managed Keycloak at scale actually requires, and what we bring to it.
We did not guess. We profiled CPU, context switches, allocation, and the heap, and we let each layer of evidence narrow the next. We were willing to disprove our own first theory the moment the data pushed back. And we did not stop at "it is a Quarkus internal," we went down to the exact method, the exact field, and the exact ordering of two operations that has to occur for the failure to happen.
That is the level we operate at, on every cluster we run. When a regression lands upstream, our customers do not absorb it as mystery downtime. We find it, we explain it, and we carry the fix forward.
If you run Keycloak and would rather have a team that debugs the runtime than one that reboots it, that is what Cloud-IAM is for.
Cloud-IAM operates managed Keycloak in production. This investigation was carried out on a live 26.6 cluster.
The full story, including the upstream discussion and fix, is tracked in keycloak/keycloak#49635.